Industry Reports and Features
Analysis of Sugar Manufacturing’s Economic Contribution
20 January 2019
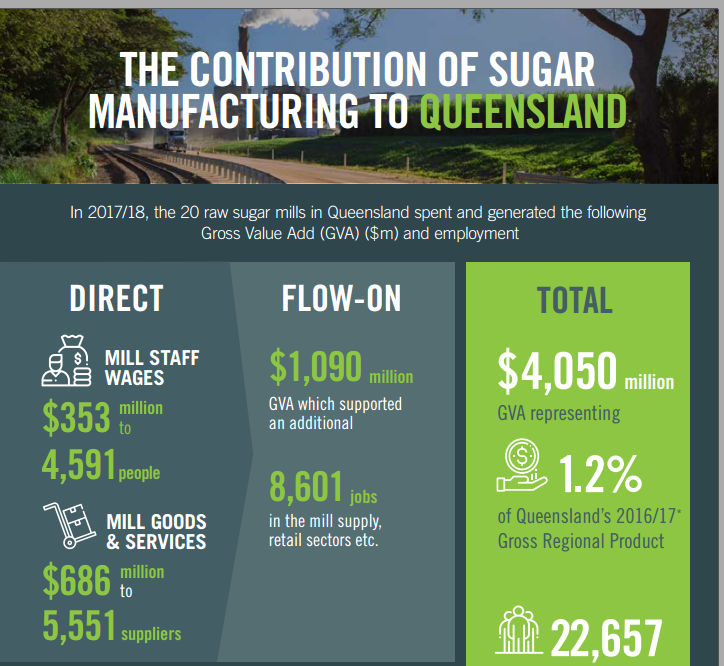
Independent analysis commissioned by the Australian Sugar Milling Council has revealed the $4 billion economic contribution made by the sugar manufacturing sector in Queensland in 2017-18.
The report from respected analyst, Lawrence Consulting, demonstrates that a prosperous sugar manufacturing industry underpins the vitality of many regional centres. The sector makes a consistently high direct and indirect contribution over time, regardless of weather and global price conditions. Read interpretation summary here.
How are the numbers calculated?
Australian Sugar Milling Council (ASMC) members provided details of their 2017-18 spend by postcode. The analysis modelled contributions in terms of direct and indirect gross regional product and jobs.
Data was provided under three headings:
(1) mill workers wages and number of workers
(2) goods and services and number of businesses
(3) cane payments and number of cane enterprises.
This direct spend was mapped and aggregated at four spatial levels – statistical divisions, local governments, and state and federal electorates. The employment and Gross Regional Product contribution at each of these four levels was also estimated.
Direct spending included everything expended, as recorded in our milling company accounts. And because the socio-economic contribution does not end there, additional ‘flow-on’ or ‘indirect’ benefits were calculated.
The Gross Regional Product and employment generated from this Type I multiplier impact was estimated at each of the four spatial levels. The additional benefits generated when the workforce (direct and indirect) spend their wages and create additional activity in sectors such as retail and personal services were also estimated. These consumption effects are known as Type II benefits.
Lawrence Consulting and the ASMC have identified the estimated Type I and Type II benefits.
Sugar manufacturing economic report
- Lawrence Consulting economic report
- Queensland Summary Infographic
- Local Government Areas
- State electorates
- Federal electorates